In the previous cycle we wrote a lot about how important a well-designed sales process is for making more sales and building a strong sales team. It allows not only to reflect the process more easily in the CRM system, to manage the team, but above all to measure the effectiveness of the sales department.
A good sales department is one in which results can not only be measured and analyzed, but even predicted.
Sales management is not only about working on the communication with the sales team. It is mainly the analysis and planning of activities based on the results generated by a well-designed CRM system. Even the best “star-rated” sales department, without proper management and measurement of results, cannot replace a well-designed process and conscious planning.
The second important element of result measurement consists in working with the sales team itself. How do you know that your salesman works at the most of his capacity? How do you assess his performance in a given month? Of course, you can presume that if the sales plan is right, then everything is ok. But it’s a big simplification because if the plan does not translate into the company’s results, you can’t really say whether or not such a person can afford twice as much or not.
So what is worth measuring in terms of sales? There are many sales productivity metrics. Let’s start with the most general ones.
Main sales productivity metrics – revenue generation
The most common and logical metric is, of course, the generated revenue in a team and individually in a given month/period. In order to take a look into the data, it is worth measuring the revenue generated per product or service. Next, it is worth considering what part of this revenue was generated by New Business customers on the basis of acquired Leads, and what part was generated by current customers of the company (Key Account Management).
If you measure the revenue generated from current customers, it will also be worthwhile to measure how much of this revenue is generated by services such as Cross Selling, Upselling, Subscriptions and others.
If you measure the revenue from new customers, the following metrics of lead generation will play an important role.
Measuring the sources of acquired leads
First of all, when analyzing the leads generated in a given month, one should take into account the basic metric, namely the number of leads generated per month. This metric is worth backing with data concerning the lead source. These are divided into Inbound and Outbound. In both cases it is worth breaking them down into exact sources like Cold Email, Adwords, Facebook Ads etc.
When measuring lead sources, the marketing department should play an important role. Namely, it should provide information about CPL or Cost Per Lead. Thanks to this you know the value of one generated Lead and are able to include it in the CRM system, giving it weight/priority. Working on lead types, sources and weights, it is worthwhile to monitor the length of the sales cycle for a given lead group, which will facilitate planning and scaling the sales process. This may lead to interesting conclusions, e.g. that the sales department has too few leads – SPC or Sales Pipeline Coverage. An important metric is also the conversion level of a given group of leads. It is measured by analyzing the number of leads that have led to a contract. In this case it is possible to analyze the process even more thoroughly and also measure how many leads have been converted to Sales Opportunities and then also translated into a successfully concluded contract. This is the so-called Conversion rate: Lead to Opportunity and Lead to Deal. This will give you a better understanding of the process and the sales funnel in the company.
When we analyse backwards the data concerning leads – those converted into customers, it is worth measuring their LTV (Life Time Value) and ACV (Average Contract Value). Such a comparison will allow you to understand if the leads generated are sufficiently profitable for the company.
Companies which put a lot of focus on analytics also happen to measure the number of leads that received another Follow up, the number of pending leads and of course the number of lost leads, all these categories further broken down into different reasons. You can also measure the number of SQL or Sales Qualified Leads generated, i.e. those that have passed the sales qualification. This is the Lead to SQL metric.
Measuring salesmen’s efficiency – KPI
Other very important metrics in the sales department are those measuring the efficiency of salespeople. Each company should set its own KPIs and targets in order to motivate, and not create artificial requirements that cannot be achieved, thus being some sort of a punishment tool for the manager.
Among the efficiency metrics, it is worthwhile to measure the number of outgoing calls made and the average call duration, as well as the total call duration. The average number of meetings with customers is also a frequently used metric. Here it is worth adding a metric of meetings ended with an offer, a factor that increases the effectiveness of the team.
Some teams also measure the number of submitted offers or use the Offer to Deal metric.
Hubspot was an interesting example here, whose management once pointed out that the number of offers submitted in the organization was very high, but the number of closed transactions was completely unsatisfactory. As a result, the company’s management proposed that in order to improve forecasting, a model would be implemented under which a salesman would receive a quarterly commission only on those sales which he recommended for a given period.
As a result, within the cycle, the number of offers has decreased, but the number of sales has doubled.
Additional performance metrics for the sales team
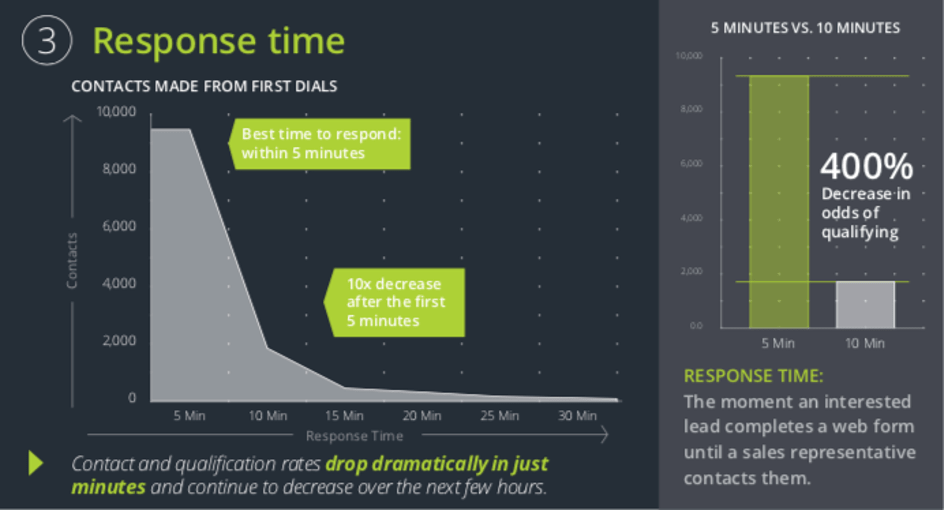
When one takes a closer look on the performance of the sales team, it is possible to delve into their activities and also measure the average response time to a new lead and the number of telephone attempts made on average per Lead.
According to data from 2014 carried out on more than 14,000 companies in the USA, the response time to a new lead has a dramatic impact on the conversion rate. Unfortunately, after only 5 minutes, the level of Lead to SQL conversion is even 10 times lower.
According to SalesForce data based on the data collected from U.S. companies in 2017, more than 78% of the customers who left the contact on the website started to work with the service provider who first contacted them!
Another very interesting study revealed that for more than 30% of the generated B2B leads, there was never any contact between the salesman and the potential customer for qualification and further processing.
The same study showed that in order to maintain 90% conversion from Lead to SQL, as many as 6 contact attempts are needed. Unfortunately most merchants make a maximum of one or two calls, which gives them a 30% chance of conversion.

The quality of the phone calls is definitely influenced by the time they are made. According to the research, the best time to make business calls is Wednesday and Thursday. Interestingly, it turns out that calling on Thursday is more than 49% more efficient as compared to calling on Tuesday.
The best hours for making phone calls are 8:00 – 9:00 in the morning and 16:00 – 17:00. The worst time of the day is 11:00 – 12:00 and 14:00 – 15:00, i.e. lunch and second breakfast hours.
When it comes to phone calls, what matters is not only their frequency but also the quality.
According to research conducted by the Crunchbase platform, the difference between the seller and the customer in the way the same call is interpreted is enormous.

As the above illustration shows, the difference in the perception of a conversation can be very big. Many salespeople are convinced that they can meet the needs of their customers whereas what they actually do is to present the company’s offer.
A good salesman is one who each time presents the company’s offer in a different way, as each time he bring it up, it is in the context of what he has heard from the customer and according to the customer’s needs. This is exactly what building value for the customer is all about.
In order to be able to measure the metrics described above, it is necessary to have a well-designed sales process and have an appropriate sales culture in the company. You can find out what a sales culture is from our latest article in this cycle.
A CRM system should be modeled on the basis of the sales process, the selection of which should also be based on what data it is meant to provide.
Remember that a well-functioning sales team is not one in which a salesman works on a process and is responsible for its results, but one where a group of people, acting in accordance with the designed process, together strive to achieve the company’s goals.